How Airports Can Use Data To Make the Right Choices for Safety and Service in a Pandemic

Challenge
Many large airports have been designed to accommodate consistent and significant volumes of people to enable airlines to operate peaked schedules effectively. This is particularly true of large hubs such as DFW, ATL, and MSP (homes to hub airlines), that are typically designed to manage a vast amount of interconnecting traffic across several daily peaks.
The Pandemic has reduced passenger volumes by around 95% and a return to pre-COVID-19 passenger numbers is likely to be suppressed. However, several airports including DFW and SEA have already seen passengers begin to return. As an example, Dallas Forth Worth (DFW) has seen passenger numbers grow from 10-12,000 per day in the early days of the pandemic to over 40,000 per day during May.
The challenge is ensuring that airports are prepared. As passenger numbers begin to increase again, there will be a renewed focus on the passenger journey, with safety and reassurance at the top of the agenda for staff and passengers alike. This will go hand in hand with ensuring flows through the airport are as efficient and stress-free as possible. There are many opportunities to use passenger flow data, either on its own or blended with other data, to meet these new goals, and passenger wait times are just the start.
Solution
As a leading provider of passenger flow data, Xovis’ use cases have transformed during this uncertain time. Managing long queues and keeping wait times low are no longer a top priority for airport staff but rather instilling confidence in the customer and reassurance that their journey will be safe.
What data is available from Xovis?
- Actual and Predictive Wait Time
- Dwell Time
- Desk Allocation
- Passenger volume
- Throughput per lane or per checkpoint
- Queue Length
- Fill Level
- Physical Distancing Maps (Coming June 2020)
These metrics can be used to gain valuable insight to understand not only how wait times across all checkpoints and terminals change, but also the demand profiles and relative efficiency of each of the checkpoints across the day or week enabling live and historical performance comparisons.This can be achieved by looking at the passenger counts and throughput figures over time on a per-checkpoint and per-terminal level basis, and historical information can often be used to predict cyclical peaks or produce capacity-based alerts.
The evolution of security checkpoints
Passenger checkpoints are natural congregation points in the airport; every passenger must check-in, pass through security, and in some cases, cross a border and collect their baggage. Checkpoints and baggage halls naturally push people closer together than they otherwise would be. At a time where social distancing is crucial to limiting the spread of the virus, a renewed focus on maintaining a safe distance in these checkpoints, or to implement load balancing of passengers across more than one checkpoint, will be a key aspect of passenger safety. This may mean changes to lane layouts to increase space, or capacity restrictions, which results in larger spaces being required for the same number of passengers. It may also result in a slower security screening process and slower delivery of baggage, reducing the overall capacity of these places.
Knowledge is key in planning for customer safety. Passenger flow data from Xovis provides a useful feedback mechanism based on real-time metrics, and can help map demand profiles across the day. This will help airports understand their peaks and know how their infrastructure performs relative to forecasting and planning. Historical data can identify peak throughput of checkpoints at their busiest times and help to set a benchmark for what maximum throughput could be under new social distancing measures. This information can help to understand staffing requirements for checkpoints in the right place at the right time, ensuring checkpoints are ready to receive passengers before queues develop.
Xovis live views can also be used to help understand flow dynamics and assess the effectiveness of social distancing measures, delivering capacity-based alerts to operations teams, and help to pro-actively maintain acceptable distance and capacity in facilities across the airport. A post-operational review can help understand checkpoint efficiency, allow teams to judge the effectiveness of processes, and change things for the better. The live view allows staff to observe checkpoint performance remotely, which brings the ability to see the airport operation at a glance, from anywhere.

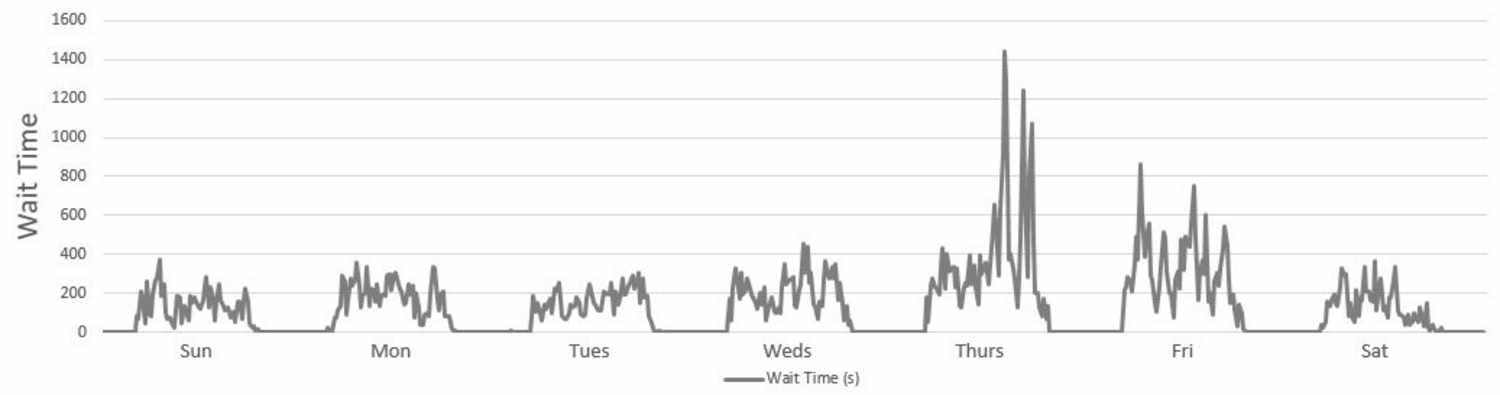
Checkpoint wait time and passenger volume data visualised for a week
Passenger empowerment
Wait time data also plays a part in passenger reassurance; live wait time information can be displayed to passengers at checkpoints and through mobile apps. Dallas Fort Worth International Airport already has an app-based integration of live wait times that enables passengers to guide themselves to the closest checkpoints with the least waiting time, giving the customer greater visibility and choice on their journey. DFW plans to release an upgrade to their app that will incorporate predictive features using passenger flow forecasts and airline schedules. This will allow customers who are traveling to be able to plan ahead and know exactly what to expect when they arrive at the airport.
“The most direct benefit of having wait time technology/sensors installed at DFW is being able to review checkpoint performance holistically and remotely. This is a huge advantage for displaced operational staff in the pandemic.” – Jonathan DeJesus, Senior Customer Programs Manager
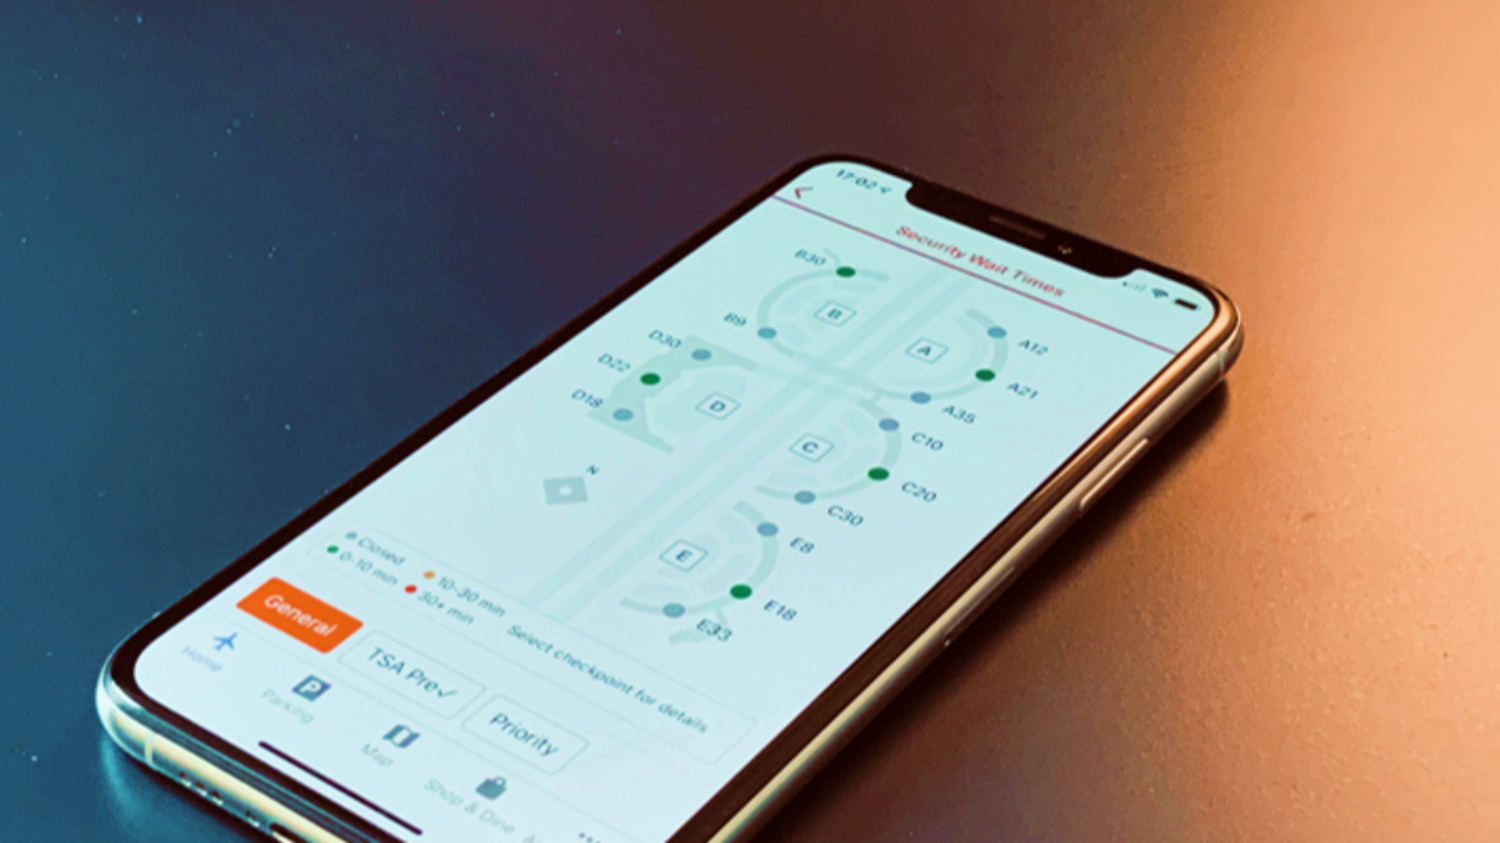
Dallas/Fort Worth International Airport (DFW) mobile app
Changing airline processes
In addition to many onboard service changes, the way people interact with the airlines in the terminal is also set to change fundamentally. Social distancing for check-in queues will result in an increased need for spacing, and self-service options may require cleaning between uses; passengers may bypass one or more processes because they will use app-based services.
Boarding aircraft may take longer, even with fewer passengers, because of queue space; jet bridges are a common area where queues form when boarding. Flow measurement and control in these areas is critical to maintaining safety and efficiency. Passenger flow data can provide insight into capacity and fill level of these critical spaces, allowing airports to adjust their processes accordingly.
A new vision for concessionaires and facilities
Concessionaires are vital for passengers – food and beverage and access to amenities before travel is an essential part of the passenger journey. High-touch spaces like bathrooms will see increased levels of cleaning throughout the day, and stores may need to create safe spaces by limiting capacity. Sensor-based data can help quantify passenger flow through these facilities and help concessionaires make informed decisions about when to deploy and schedule cleaning and define safe levels of occupancy to allow passengers to shop, dine, and relax as normal.
Results
Airports designed to accommodate exceptional growth in air travel demand can expect to see passenger numbers return, long term; but with these passengers come new priorities. The influence of the pandemic on current and future airport design remains to be seen, but features that ensure safety and provide reassurance to passengers and staff as travel demand returns will be key to success.
Airports are a synergy of closely-related components that come together to deliver a seamless travel experience from curb to gate. From security services and airlines to retailers and food outlets and handling agents, a multitude of organizations need to work together to make thousands of daily journeys happen without delay; quantitative data about passenger flow around the airport accessible by organizations and individuals who need it can be an invaluable tool in helping airports deliver exceptional service to passengers in the 'new normal'.
Get in touch!
We are at your side to master the challenge.