Physical Analytics in Airport Terminals: Measuring to Improve
The statement holds true for many areas of our private life—from running to sleeping—but the stakes of ignoring the concept are much higher for businesses. Among those with the most at stake: airport terminals.
Why? Because in airport terminals, inefficiencies on a second-by-second basis can create major headaches downstream. It’s why airports need accurate, precise real-time and historical data about curb-to-gate and gate-to-curb passenger flow.
Ask any operations manager at a terminal facing capacity constraints—which, to be honest, is most—and they will tell you the same thing: We are trying to gain throughput/processing-time efficiencies measured in seconds per passenger.
Those gains may seem minuscule at the individual level, but they are considerable in the aggregate. And the aggregate is what matters, for passenger satisfaction, terminal operations, and revenue generation.
The “Coming to America” Example
Immigration lines are rough. You just finished a flight, often long, and the last thing you want to contend with is a hooting crowd in a marathon line. In a perfect world, there would be an immigration agent for every passenger. No waiting! But that’s neither economically nor logistically feasible. Sorry.
Consider the image below, a depiction of what a passenger might see when they arrive at their (air)port of entry. Current waiting time is around 32 minutes, with a queue length of 107 passengers. With only four counters open, throughput is limited to 200 passengers per hour — a capacity level that inevitably leads to growing queues and extended delays.
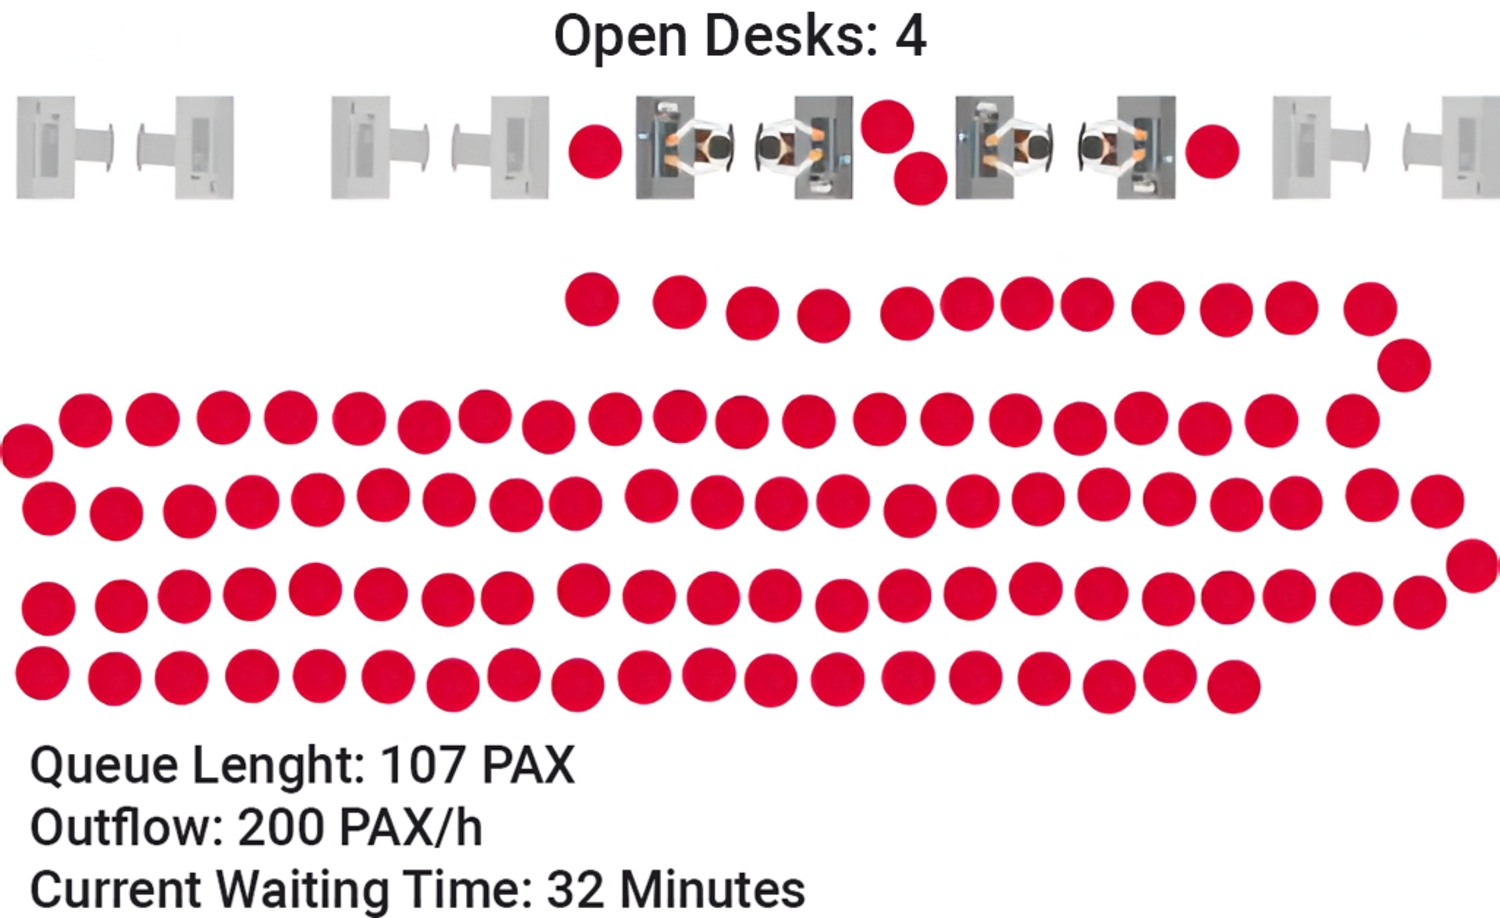
Now, when airport operators can foresee that without additional processing capacity they are going to be dealing with a crowd of unhappy travelers, they can take the proactive decision to open more lanes. By increasing processing capacity on an ad hoc basis, they can quickly reduce waiting times and stabilize the process.
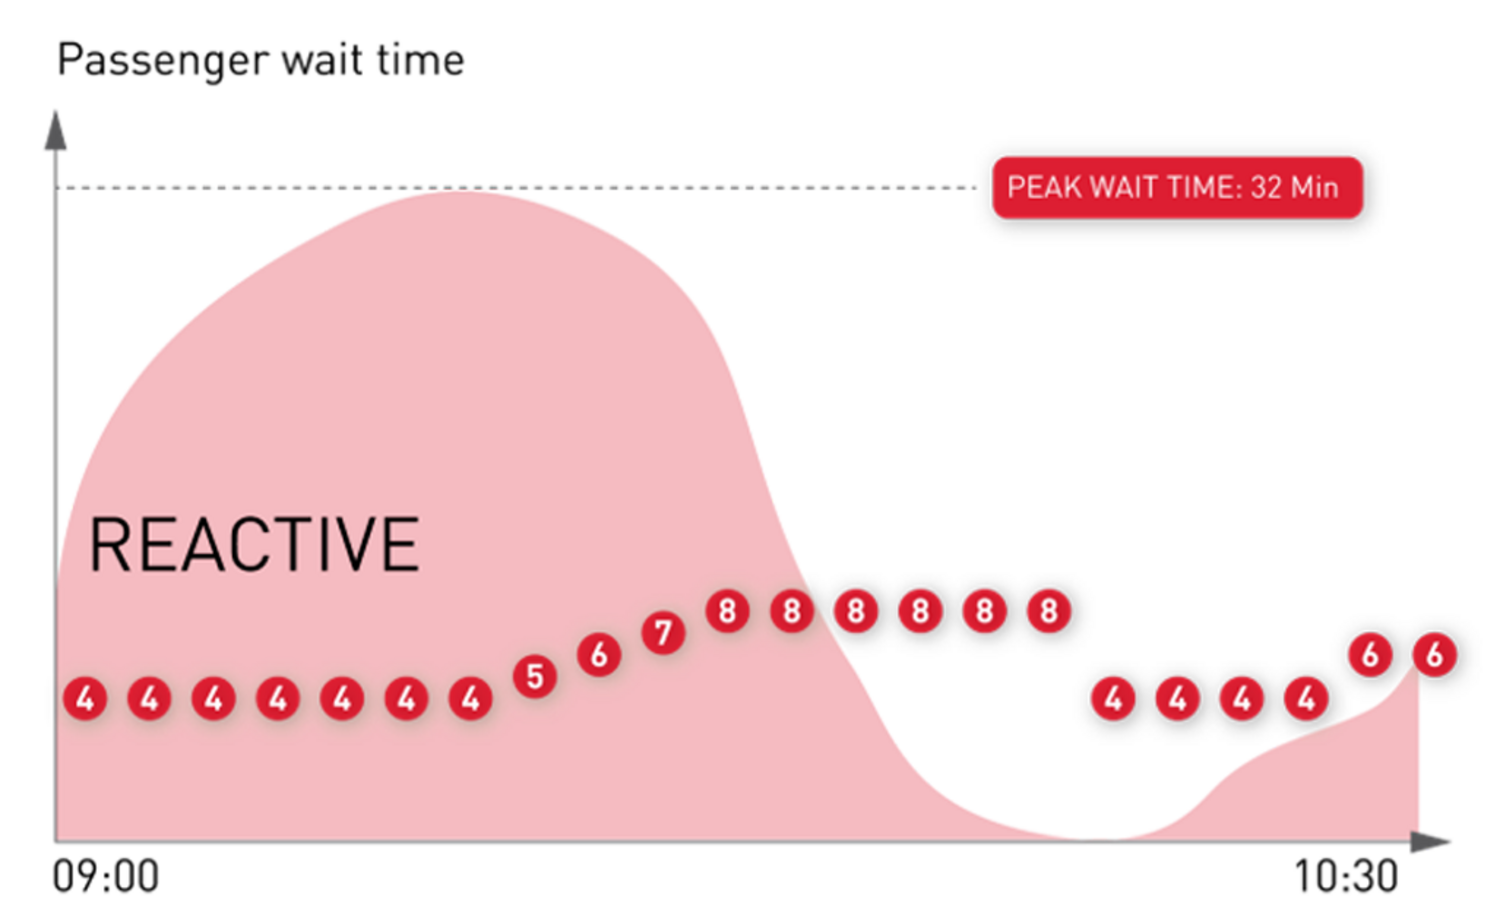
Airports involve flights that, also in a perfect world, arrive and depart according to precise scheduling. In the real world, delays and cancellations wreak havoc on planning, and you can count on many people pushing through lines to catch a flight or connection. Good luck!
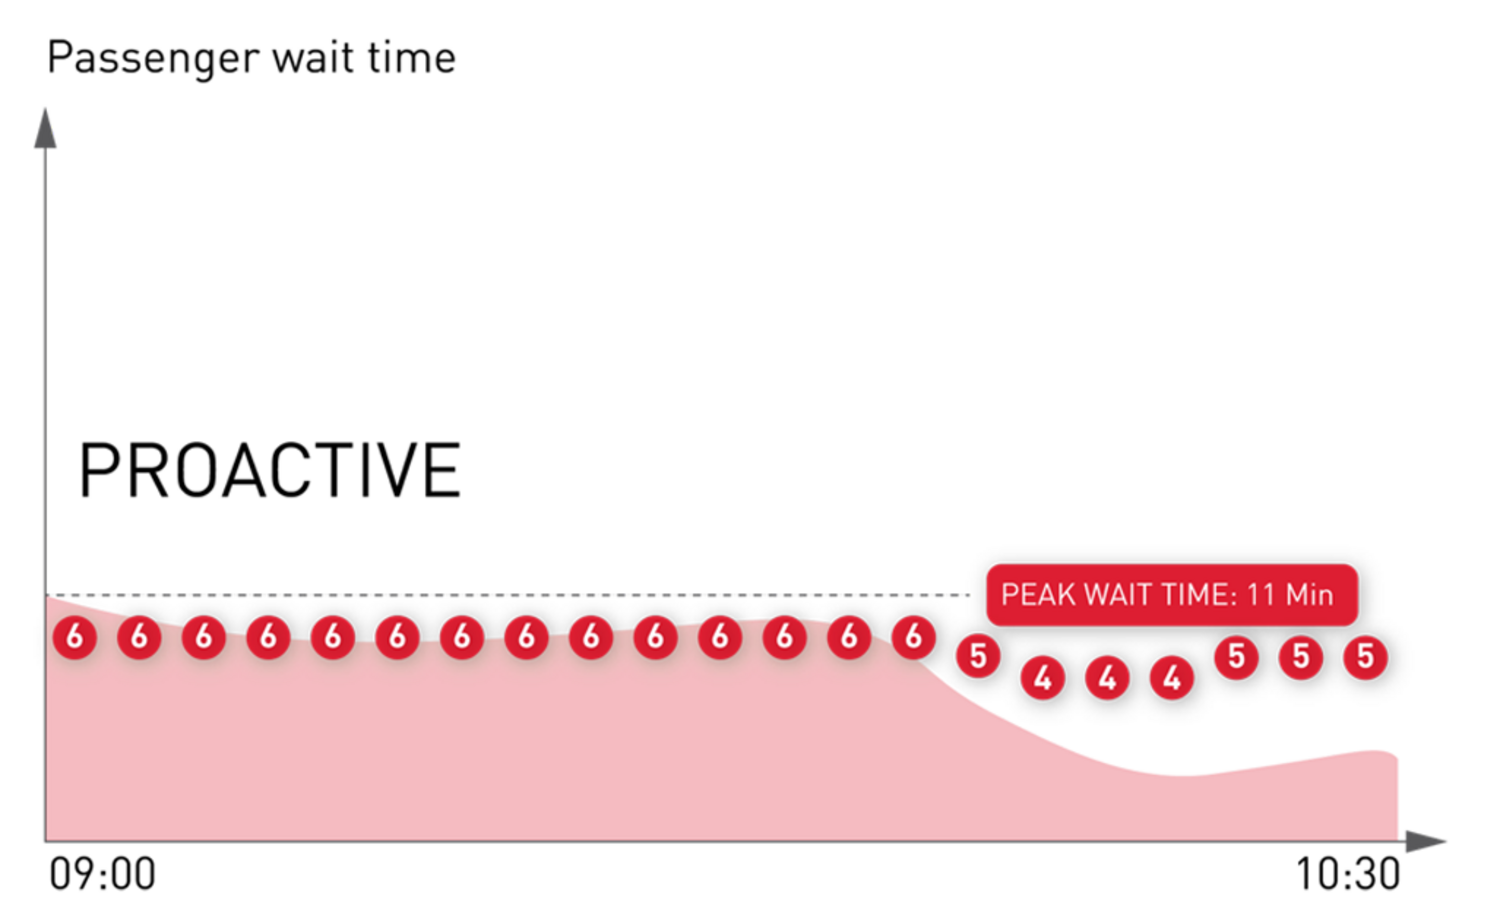
Even with unforeseen circumstances, airports over a long enough period have a rhythm. Airports that pick up on that groove with accurate, historical data can start anticipating trends and planning ahead of time. By scheduling sufficient staff at the right times, before the crowds start to form, airports can move from reactive intervention to proactive management.
Compare the proactive situation below with the reactive situation above. Better, right?
Scan to measure
The logic that guides planning at immigration is equally applicable to many other mission-critical and non-essential touchpoints. That includes security screening, where measuring performance per lane is critical.
Airports globally are already investing in or considering investing in new body scanners or X-ray machines that promise higher passenger throughput per hour. I’ve yet to see an airport jump headfirst into this new tech—retrofitting their entire security setup without testing. Because it’s only with a clear baseline that you can assess the true impact of the upgrade — and determine whether the investment delivers meaningful improvement.
If you have transparency on process times and, even more importantly, on throughput per lane and per scanner, you can take a structured approach. For example, you might replace one dual lane first and measure the actual performance gain before scaling further.
Alternatively, you may discover that the greater lever lies upstream — by optimizing queue management and passenger flow into the checkpoint, increasing throughput and reducing waiting times without major capital investment.
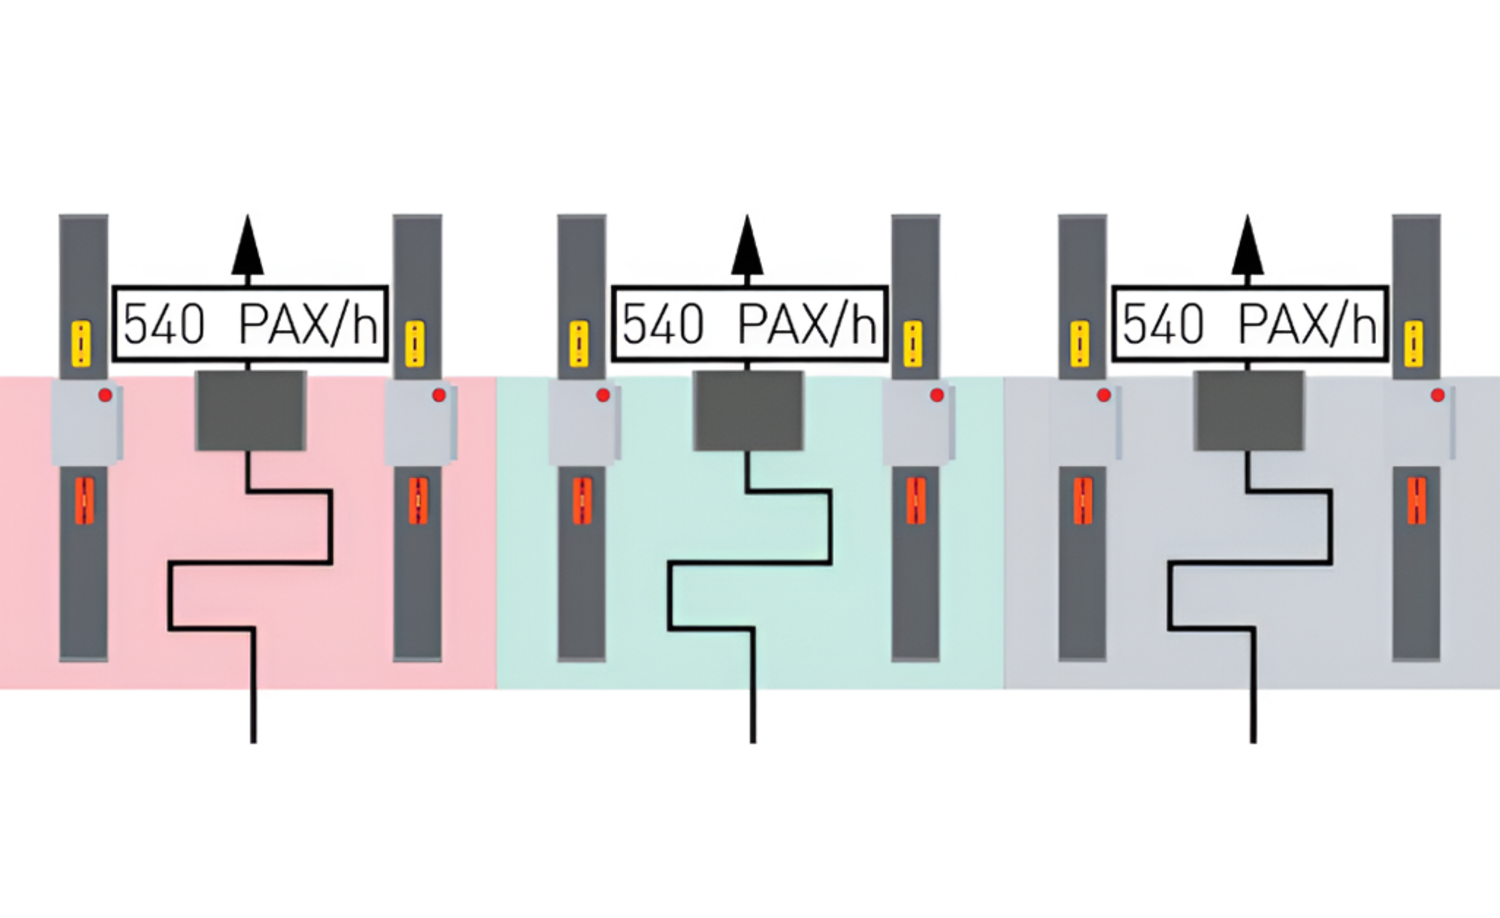
These pics are, obviously, for illustrative purposes. Actual performance varies significantly by airport.
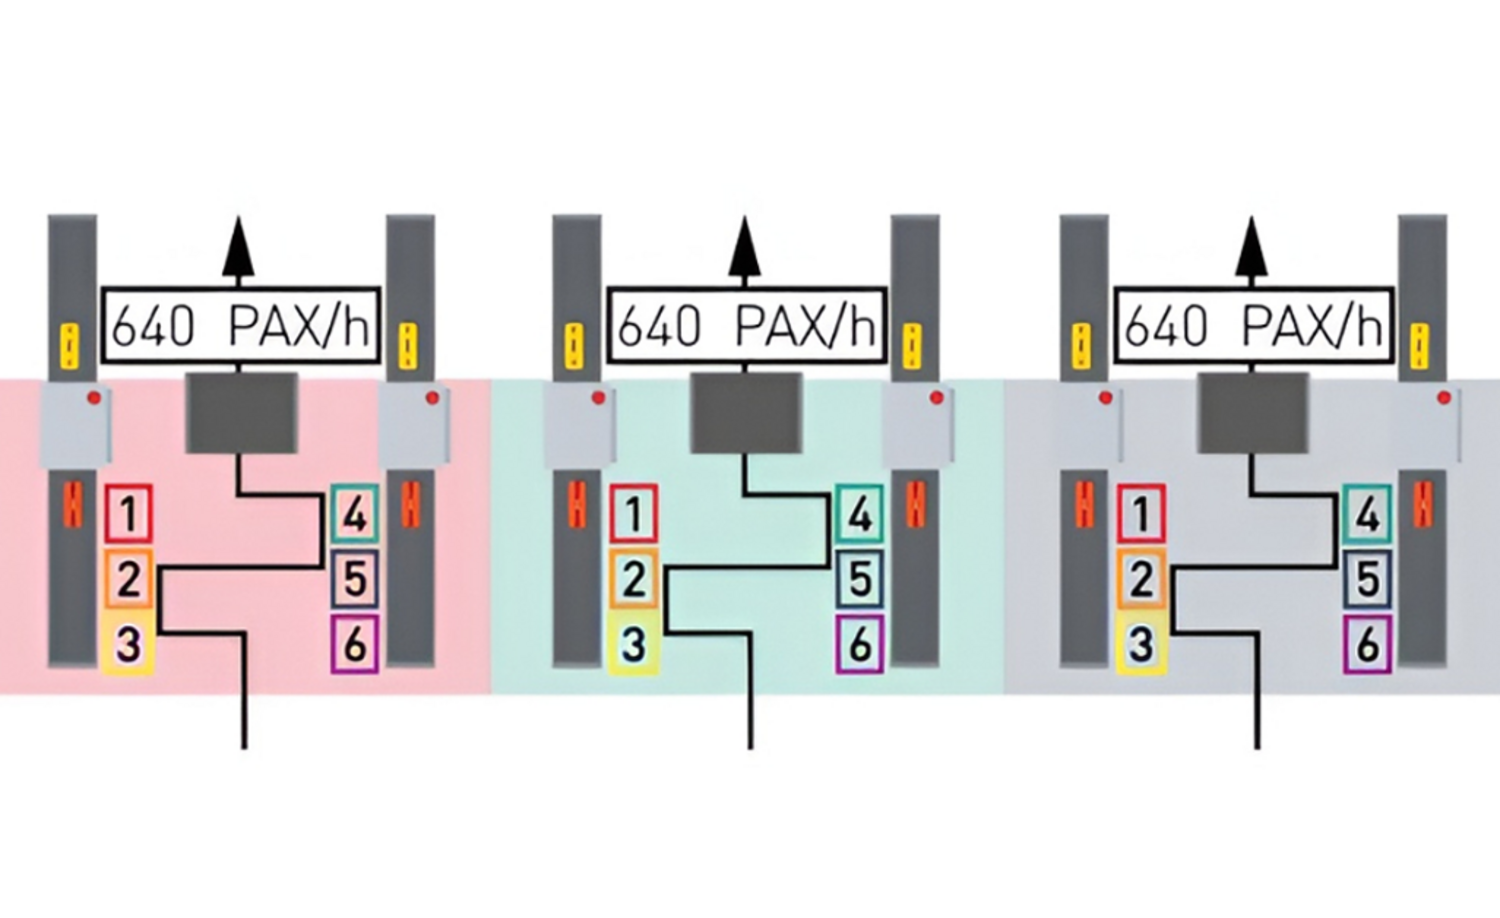
By testing different queue designs, airports can objectively measure which setup delivers the best performance in their terminal.
For example, airports may find that replacing three separate queues with a single centralized line — assigning passengers to the next available lane at the final stage — increases throughput and reduces waiting times.
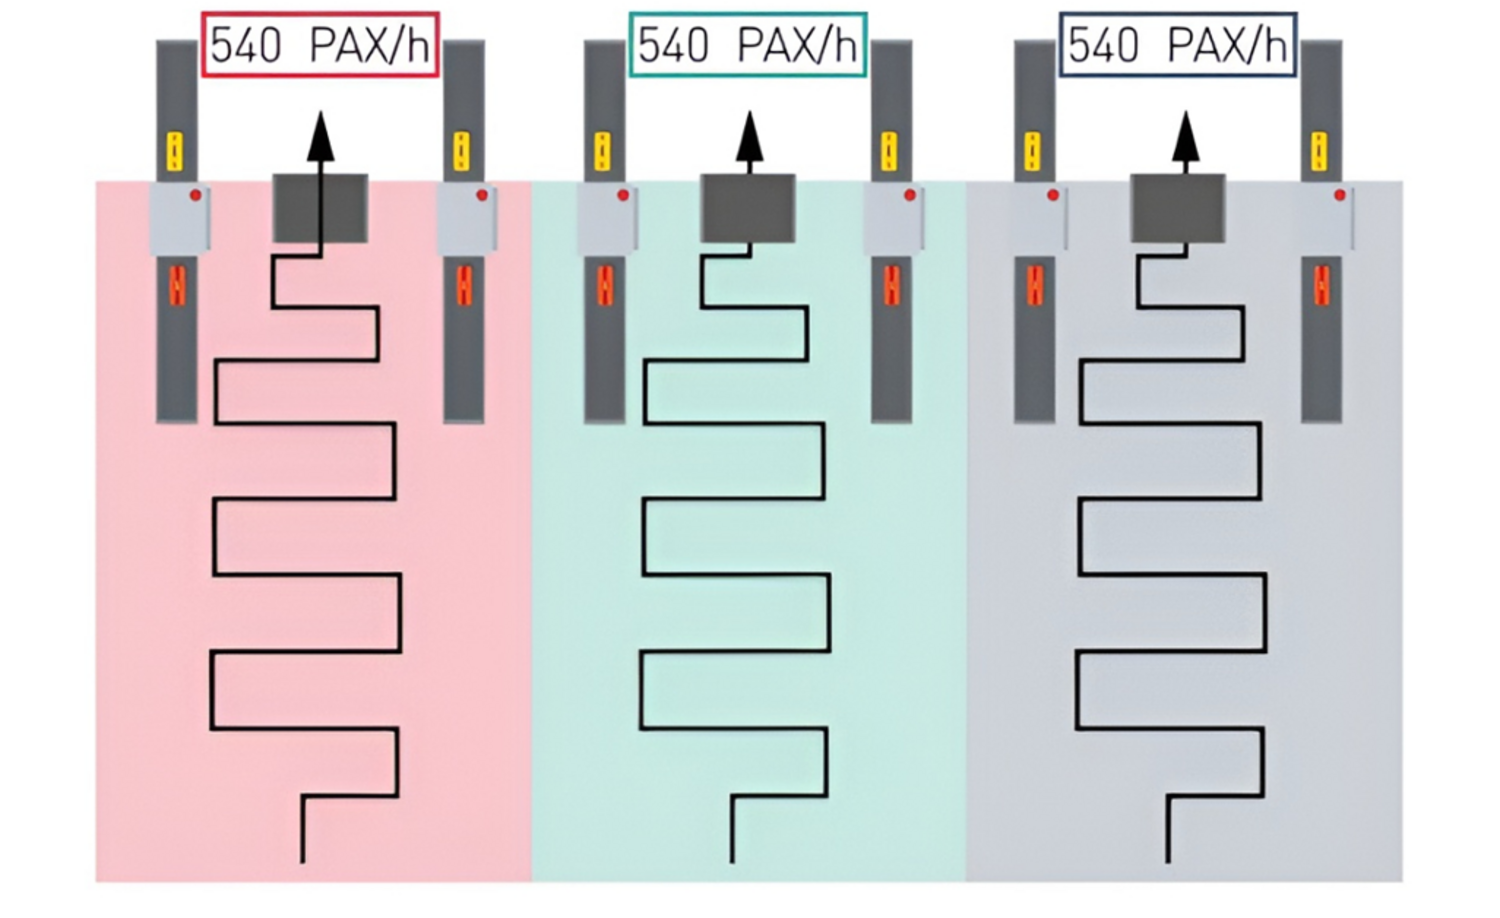
In other cases, the opposite configuration may prove more effective.
The key is to base the decision on measured performance rather than assumptions.
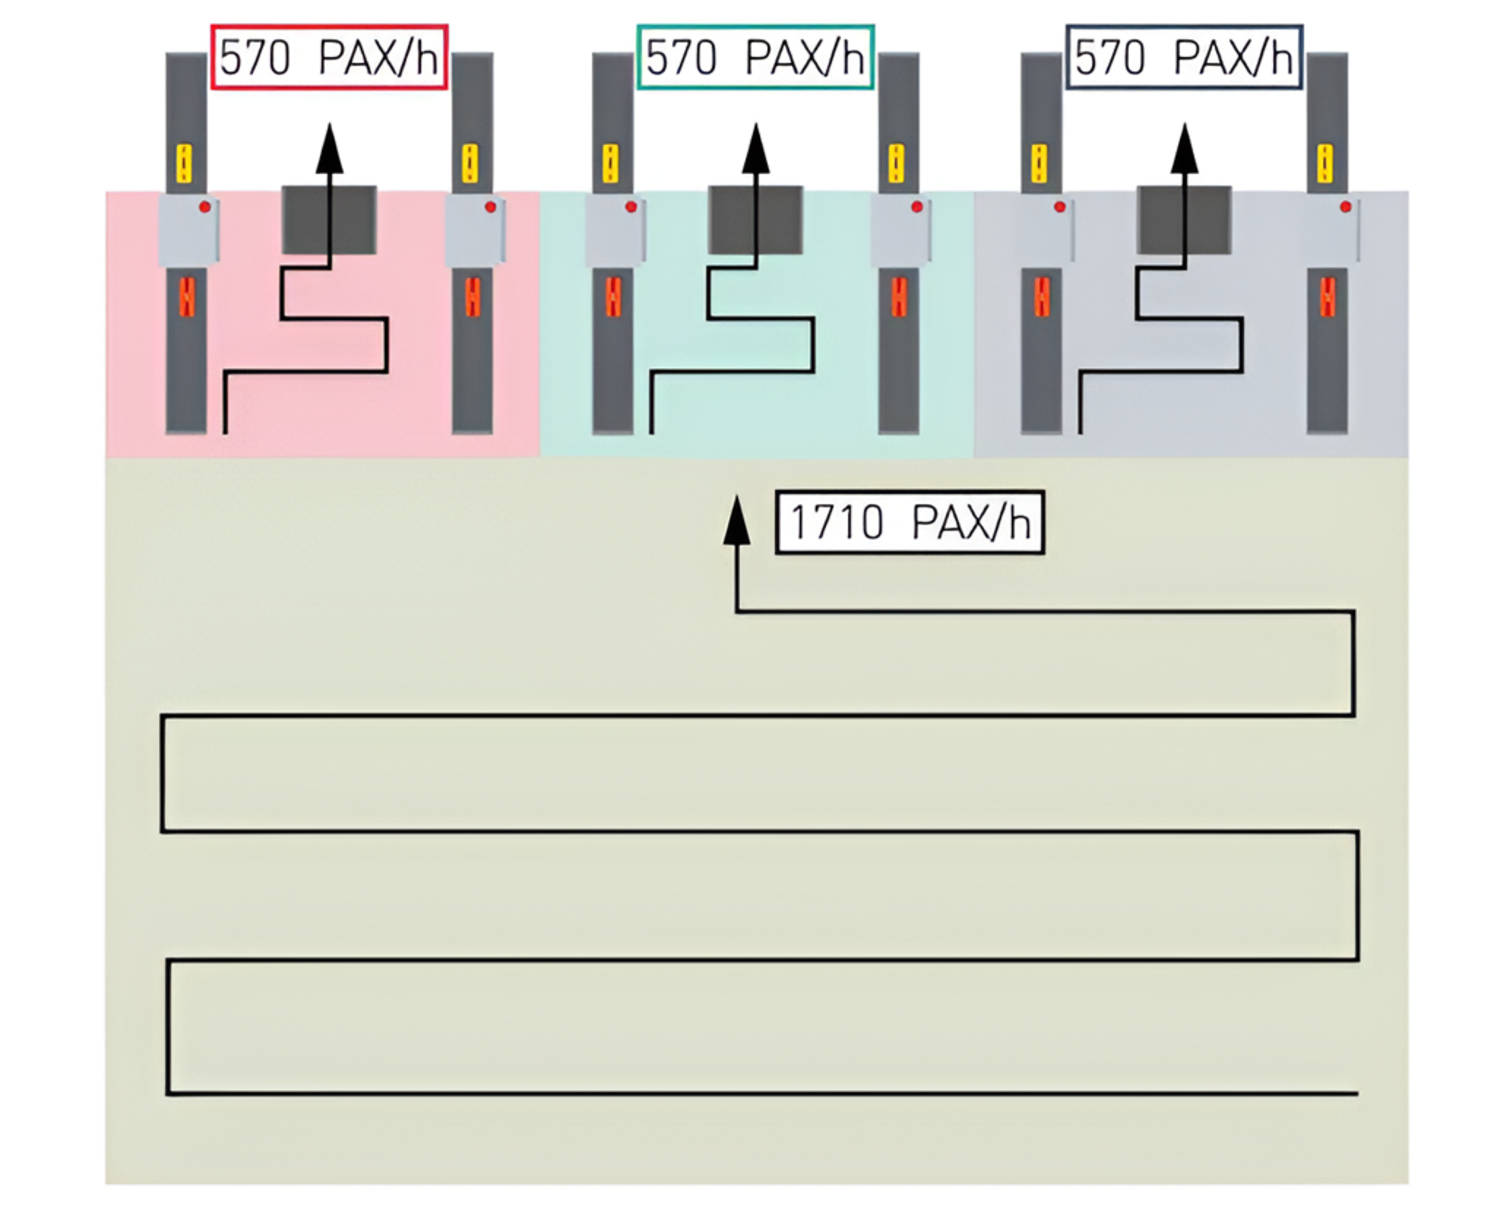
An airport can then test a new X-ray machine equipped with an automated tray return system, allowing passengers to retrieve trays seamlessly at the end of the process. After implementation, they observe a measurable increase in throughput — validating the operational impact of the upgrade.
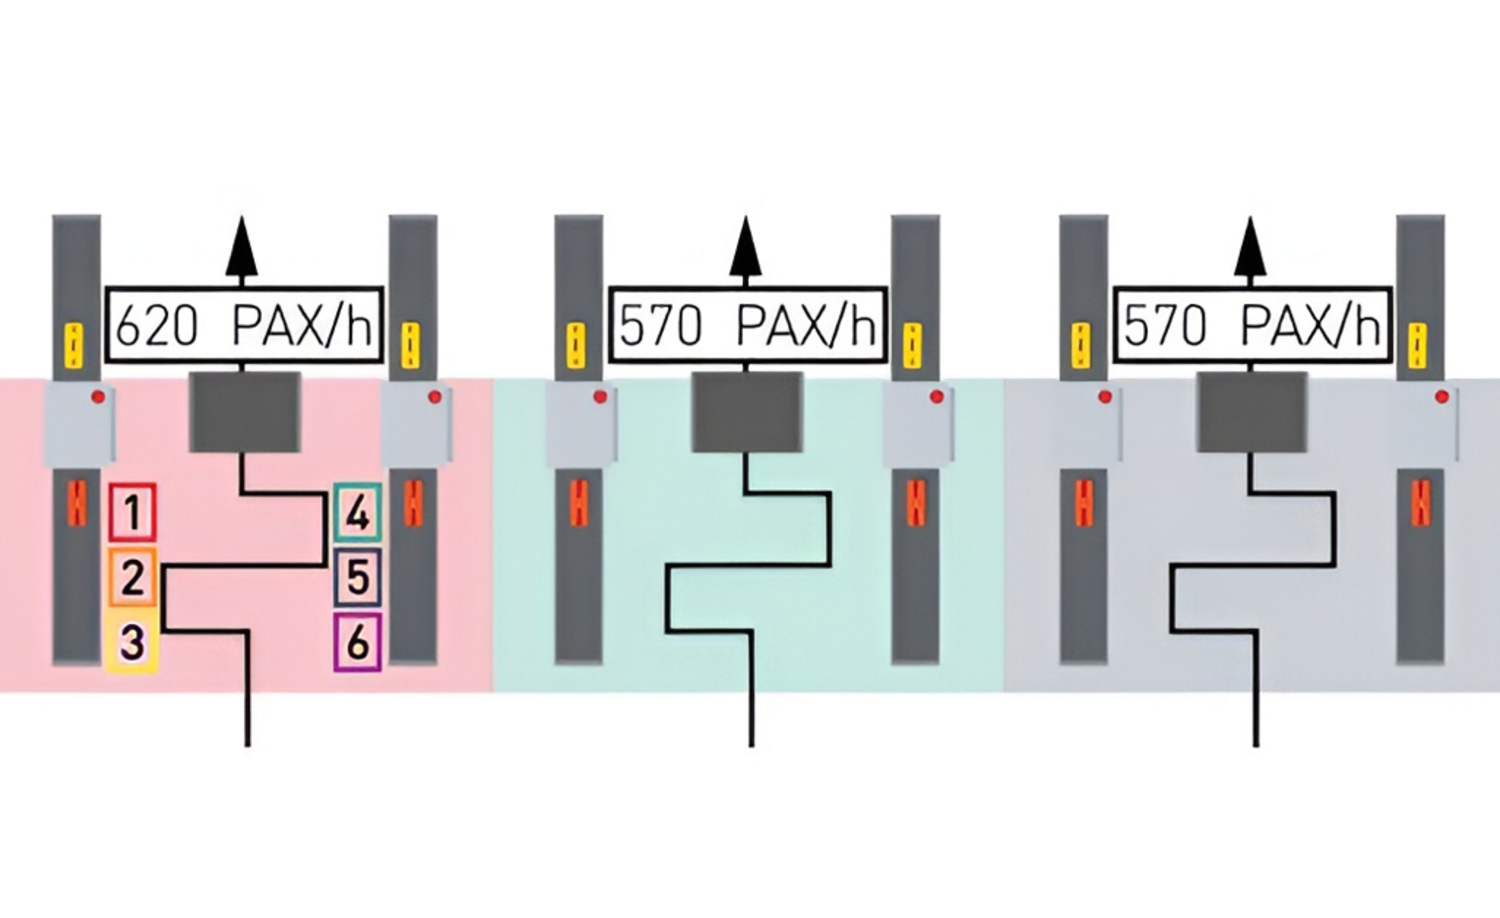
Based on these measurements, the airport decides to equip all screening lanes with the new X-ray machines, scaling the proven performance improvement across the entire checkpoint.
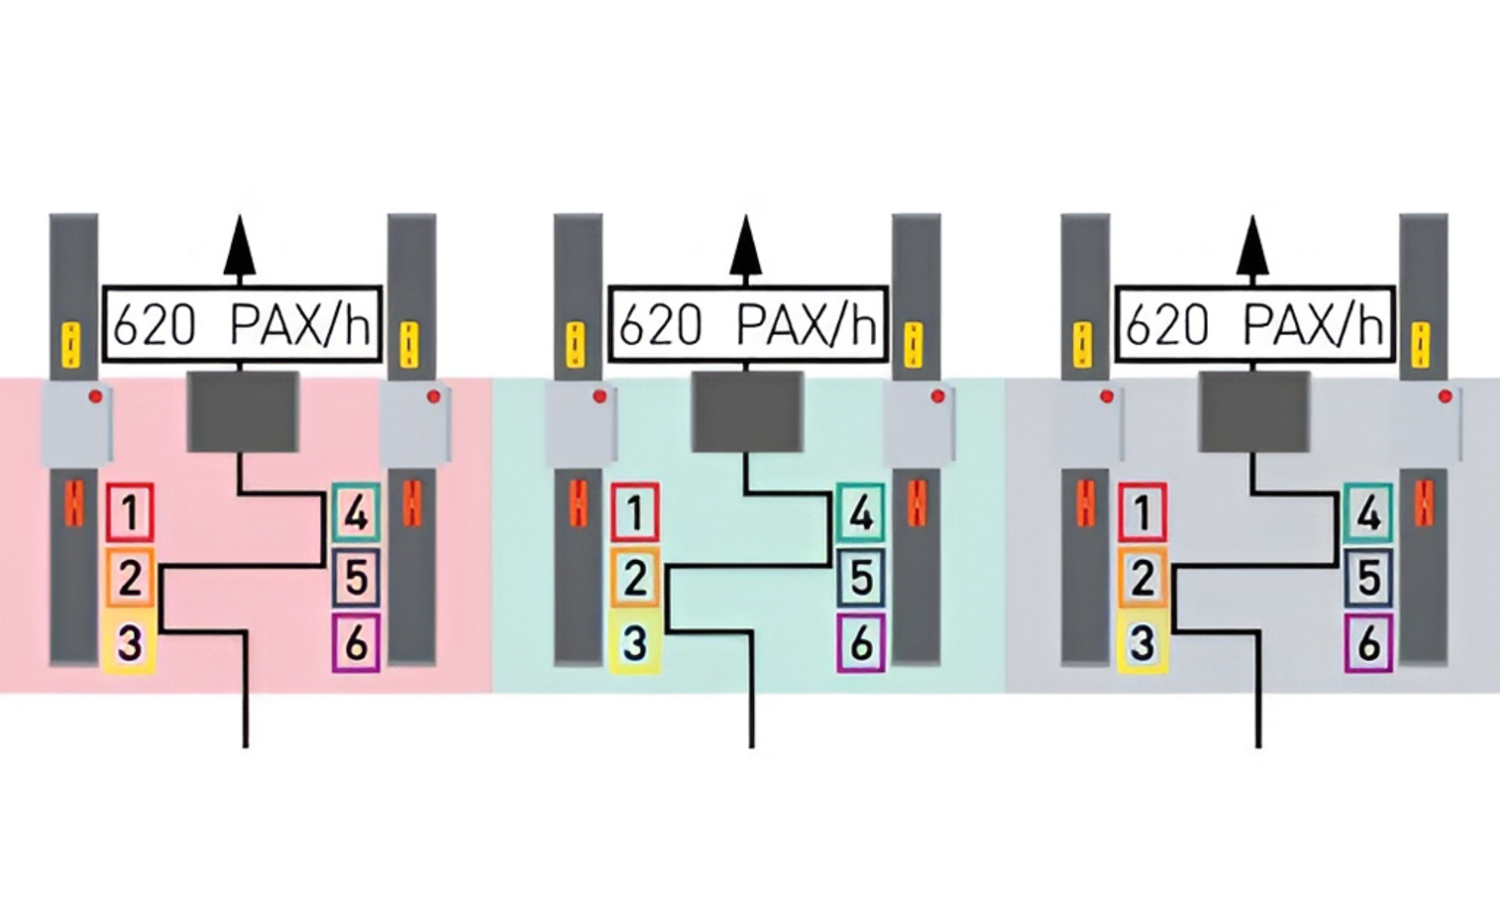
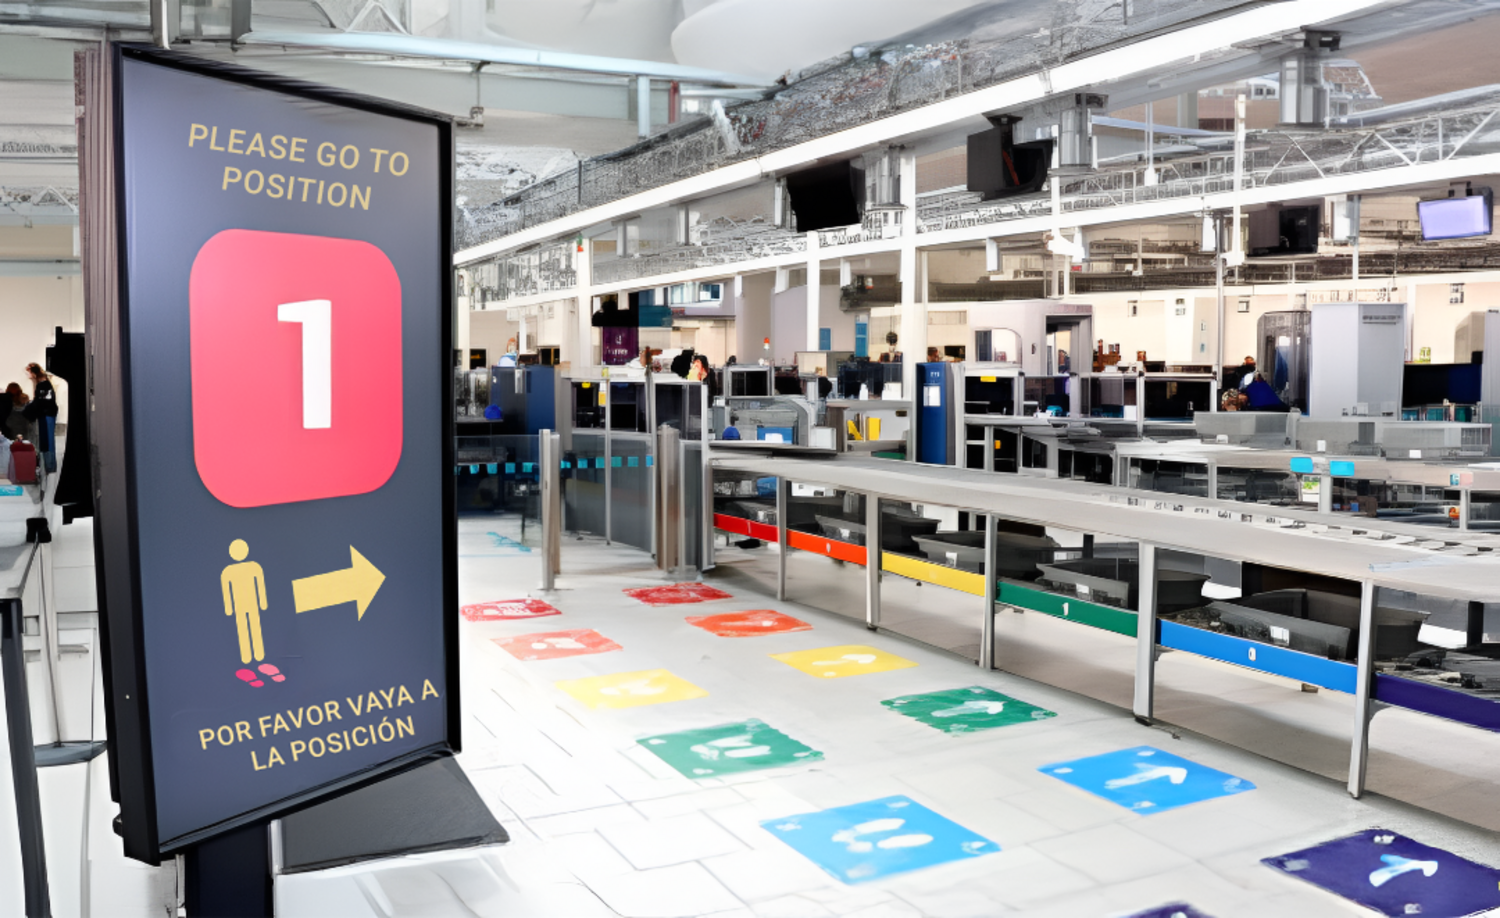
At a major European airport, a self-developed call-forward solution — powered by real-time data from Xovis’ Passenger Flow Management System—identifies which lanes are least occupied and which divesting positions are available. Dynamic, smart systems like this not only optimize passenger allocation and improve screening efficiency, they also dramatically reduce operating costs.
Beyond Measuring
It’s been said often (including at the start of this article): If you want to improve, you have to measure. Accurate measurements in the airport environment are crucial for many things, including planning future expansions. In many cases, accurate measurements can help terminal operators avoid costly expansions by showing them where improvements can be made.
And they can do much more. As terminal operators know, efficient processes are the bedrock for better passenger experiences. With the right system and with the right data, those measurements can become powerful tools for optimizing your processes for maximum efficiency.
Tags: | summer travel | airport | peak travel | PFMS | KPI |